Looking for the best AI chart generators? Explore our collection of top-notch AI-powered tools for creating charts and graphs.
Introduction
In today’s data-driven world, the ability to effectively visualize information is crucial. Whether you’re a business analyst, a marketer, or a student working on a research project, charts and graphs are essential tools for presenting complex data in a visually appealing and easy-to-understand manner. However, creating compelling visualizations can be a daunting task, especially if you don’t have a background in design or data visualization. That’s where these best AI graph generators come in.
AI chart generators leverage the power of artificial intelligence to automate the process of creating charts and graphs. With these tools, you can transform raw data into stunning visualizations with just a few clicks. In this article, we’ll explore the six best AI chart generators available today and delve into their features, benefits, and use cases. So, let’s dive in and discover how these innovative tools can revolutionize your data visualization process.
1. Chartify AI: Simplify Data Visualization
Overview
Chartify AI is a cutting-edge tool that streamlines the data visualization process, making it accessible to users of all skill levels. Powered by advanced machine learning algorithms, this tool offers a wide range of chart types and customization options to create visually stunning representations of your data.

Key Features of Chartify AI
- AI-powered tool for generating interactive charts and graphs
- Supports data upload from CSV files, Postgres, and MySQL databases
- Provides intelligent recommendations for visualizations based on the uploaded data
- Offers a variety of chart types including pie charts, bar charts, and line graphs
- Allows users to request specific chart types and provides multiple options and styles
- Eliminates the need for manual coding of charts in libraries like Plotly
- Removes the frustration of using chart editors in applications like Google Sheets and Excel
- Integrates with popular charting libraries such as Plotly, Matplotlib, Seaborn, and Charts.js
- Intuitive interface for easy interaction and exploration of data
- Enables users to explore data from different angles using a range of visualizations
- Facilitates the generation of engaging and data-driven insights.
Use Cases of Chartify AI
- Business Presentations: Whether you’re pitching a new product or presenting financial data to stakeholders, AI Chartify helps you create visually engaging charts that captivate your audience and convey your message effectively.
- Academic Research: Students and researchers can leverage AI Chartify to visualize their findings in a visually compelling manner. Presenting data in an appealing format enhances understanding and facilitates knowledge dissemination.
- Social Media Marketing: Engage your audience on social media platforms by sharing eye-catching charts and infographics. AI Chartify enables you to create shareable content that stands out in a crowded digital landscape.
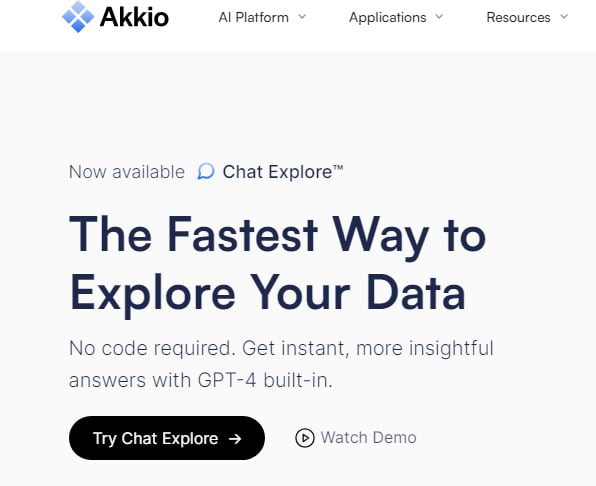
2. Akkio Chart Generator AI: Powered by OpenAI’s GPT-4
Overview
Akkio is one of the Best AI Chart Generators AI is an intelligent tool that combines the power of AI and data analytics to generate insightful charts and graphs. Designed for professionals in various domains, this tool helps you unlock the hidden patterns and trends within your data, enabling data-driven decision-making.
Key Features of Akkio Chart Generator AI
- Natural and intuitive data interaction: Chat Explore allows analysts and data managers to interact with their data using natural language queries.
- Prompt engineering: Akkio performs the prompt engineering by combining the natural language ask with the metadata from the table, which is then fed into GPT-4 to generate Python code.
- Generation of charts and insights: The generated Python code is executed on the data to generate the requested charts or insights.
- Conversational AI experience: Chat Explore leverages GPT-4’s conversational AI capabilities to provide a more natural and conversational experience for users, without exposing them to backend operations or requiring them to learn a new coding language.
- Simplified analysis: Data analysts can use Chat Explore on a daily basis to analyze datasets, create graphs, and remove the need for coding, allowing less technical individuals within the company to participate in the analysis process.
- Live data source integration: All charts and graphs generated by GPT-4 can be connected to live data sources, enabling real-time data visualization.
- GPT-4’s potential: GPT-4, with its advanced natural language processing capabilities, image recognition, and improved input engineering, has the potential to revolutionize technology interaction and create more powerful conversational experiences across various use cases.
- Enhanced productivity: By leveraging GPT-4, Chat Explore contributes to significant advancements in business and boosts team productivity by a factor of 10.
- These features highlight the unique capabilities of Akkio’s Chart Generator AI, powered by GPT-4, in facilitating data analysis, chart generation, and overall productivity improvement.
https://www.akkio.com/chat-explore
Use Cases of Akkio Chart Generator AI
- Business Intelligence: Akkio Chart Generator AI is a powerful ally for business analysts and data scientists. By leveraging its intelligent insights, professionals can uncover actionable patterns and trends, leading to informed business decisions and improved performance.
- Financial Analysis: Visualize financial data with Akkio Chart Generator AI to gain a deeper understanding of revenue streams, expenditures, and investment performance. The tool’s analytics capabilities help identify opportunities for cost optimization and revenue growth.
- Scientific Research: From analyzing experimental data to presenting research findings, Akkio Chart Generator AI is a valuable asset for scientists and researchers. Its intelligent insights and interactive features aid in visualizing complex scientific concepts.
3. ChartBlocks AI -Create a customized and interactive charts effortlessly
Overview
ChartBlocks is an online chart building platform that allows you to create customized and interactive charts quickly and effortlessly. With its robust features and user-friendly interface, ChartBlocks empowers you to generate beautiful charts that effectively represent the data you have collected. Whether you need to visualize sales figures, survey responses, or any other dataset, ChartBlocks provides the tools you need.

Key Features of ChartBlocks AI
- Customization options: Users can customize their charts to reflect the data they have collected, ensuring that the visuals align with their specific needs.
- Wide data source compatibility: ChartBlocks allows users to pull data from various sources, enabling them to generate charts using data from different platforms.
- Embedding capabilities: Users can easily embed ChartBlocks charts into their Bit documents, such as research documents, training manuals, reports, eBooks, and lesson plans.
- Enhanced visual appeal: Adding interactive and visually appealing charts from ChartBlocks enhances the engagement and impact of written work, leaving a lasting impression on the audience.
- Modern document experience: By incorporating ChartBlocks charts into their documents, users can create modern and dynamic content that sets them apart.
- Versatile document integration: ChartBlocks can be embedded in various types of documents, including project documents, marketing documents, and financial documents.
Use Cases of ChartBlocks AI
- Content Marketing: AI Chart Generator C is an invaluable tool for content marketers looking to create visually compelling infographics that capture the attention of their target audience. Infographics are highly shareable assets that can drive traffic and increase brand visibility.
- Educational Materials: Teachers and educators can leverage AI Chart Generator C to create engaging infographics for their lessons. Visualizing information in an infographic format helps students absorb complex concepts more easily.
- Data Journalism: Journalists and reporters can use AI Chart Generator C to create visually appealing infographics that accompany their articles. By presenting data in an accessible format, journalists can convey the significance of their stories effectively.
4. AI Knowledge Graph Generator Collaborative Charting Made Simple

Overview
Using a knowledge graph generator is a one of the top AI Chart Generators powered by AI streamlines the process of creating comprehensive and accurate knowledge graphs. It saves time, requires no technical expertise, and empowers users to gain valuable insights from their data in a user-friendly manner. By leveraging AI-generated knowledge graphs, users can make informed decisions efficiently and effectively.
Key Features of AI Knowledge Graph Generator
- Structured representation of knowledge: A knowledge graph provides a structured and organized view of data by representing concepts or entities as nodes and their relationships as edges.
- Time-saving: Manually creating a knowledge graph can be time-consuming, especially when dealing with large datasets. However, with an AI-generated knowledge graph, you can create a comprehensive visualization in seconds, saving valuable time.
- User-friendly: Knowledge graph generators are designed to be easy to use, requiring no technical expertise. The intuitive interface simplifies the process of creating a knowledge graph, making it accessible to users with various backgrounds.
- Comprehensive and accurate: AI-generated knowledge graphs offer a comprehensive representation of your data, ensuring accuracy and completeness. The generated graphs provide a holistic view of the relationships between different entities and concepts.
- Customizability: Knowledge graph generators allow you to customize the generated graphs to meet your specific needs. You can tailor the visualization by selecting relevant data, highlighting specific relationships, and adding additional information.
- Simplified data analysis: By utilizing an AI-generated knowledge graph, you can simplify the analysis of complex data. The structured representation enables you to identify key insights, patterns, and connections between various entities and concepts.
- Time-efficient decision-making: Knowledge graphs help in making informed decisions by providing a clear visualization of data relationships. They facilitate understanding and enable you to quickly extract meaningful information for decision-making processes.
https://www.taskade.com/generate/content/knowledge-graph
Use Cases of AI Knowledge Graph Generator
- Team Projects: AI Chart Generator D is ideal for teams working on projects that involve data visualization. Whether you’re designing reports, creating dashboards, or conducting research, this tool promotes seamless collaboration and enhances productivity.
- Client Collaboration: Collaborating with clients becomes hassle-free with AI Chart Generator D. You can share charts with clients, gather feedback, and make revisions in real time, ensuring that the final visualizations meet their expectations.
- Academic Collaborations: Students and researchers can leverage AI Chart Generator D to collaborate on group projects, thesis papers, or scientific studies. The tool simplifies the process of sharing and working on visualizations, even across different academic institutions.
5. Graphmaker AI: Make a graph instantly with AI
Overview
Graphmaker AI empowers users to visually represent their data in a clear and engaging manner. By leveraging the AI-powered graph maker, you can save time, make data-driven decisions, and communicate insights effectively using professional-quality charts and graphs.

Key Features Graphmaker AI
- AI-powered graph creation: Graphmaker AI utilizes artificial intelligence technology to generate graphs instantly. With AI assistance, you can create professional charts without the need for manual data entry or complex formatting.
- Variety of chart types: Graphmaker AI provides a range of chart types to choose from, including bar charts, scatter plots, pie charts, histograms, and line charts. This allows you to select the most suitable chart type to visualize your data effectively.
- Free chart creation: The AI-powered graph maker is available for free, enabling users to create professional charts without any cost. This makes it accessible to individuals and businesses of all sizes.
- Spreadsheet upload: Graphmaker AI allows you to upload CSV files or spreadsheets directly, making it easy to import and visualize your data. You can quickly transform your data into meaningful and visually appealing charts.
- Interactive data exploration: The AI-powered graph maker enables you to interact with your data. You can explore and analyze your data by interacting with the generated charts, gaining insights, and uncovering patterns in your data.
- Quick and user-friendly: With Graphmaker AI, you can create bar charts, scatter plots, pie charts, histograms, and line charts in seconds. The user-friendly interface simplifies the process, ensuring that users with varying levels of technical expertise can easily generate professional-looking charts.
Use Cases of Graphmaker AI
- Data Analytics Projects: AI Chart Generator E is an invaluable tool for data analysts and scientists. Its advanced analytics capabilities combined with powerful visualization tools simplify the process of transforming complex data sets into meaningful insights.
- Sales and Marketing Dashboards: Track and visualize sales performance, marketing campaigns, and customer data using AI Chart Generator E. The interactive dashboards enable teams to monitor key metrics, identify trends, and make data-driven decisions.
- Financial Modeling: AI Chart Generator E can be used by financial analysts to create dynamic financial models and forecasts. By visualizing financial data in charts and graphs, analysts can identify patterns and make informed predictions.
6. Appy Pie’s online AI Graph Maker: Create a custom Graph and Diagram
Overview
Appy Pie’s online Graph Maker is a comprehensive tool that empowers users to create custom charts and graphs without any coding knowledge. Whether you need pie charts, bar charts, line graphs, or other types of graphs, this tool provides a user-friendly experience and flexibility in design, resulting in visually engaging visuals to convey your data effectively.
Key Features of Appy Pie’s Online AI Graph Maker
- Easy-to-use interface: The Graph Maker provides a user-friendly and visual interface that allows you to create graphs, charts, diagrams, and flowcharts effortlessly. You don’t need any coding knowledge to utilize this tool effectively.
- 100+ Graph Design Templates: With over 100 graph templates available, you have a wide variety of options to choose from. Whether you need bar graphs, pie charts, line graphs, or other types of graphs, Appy Pie’s Graph Maker has you covered. The templates are designed to be visually appealing and meaningful.
- No coding required: Appy Pie’s AI Graph Maker is designed for non-technical users. You can create charts and graphs in less than 5 minutes without any technical knowledge. It’s a great tool for creating visuals for websites, blogs, or any other purpose.
- Text Generator (HTML): The Graph Maker allows you to add an unlimited number of words to your graphs. You can customize the appearance of the text, including adding horizontal lines to separate each word. This feature enables you to create beautiful bar graphs with ease.
- Multiple file formats: You can download your graphs in various formats such as PDF, SVG, PNG, and JPG. Whether you need high-quality images or vector-based graphics, the Graph Maker provides flexibility in choosing the format that suits your needs.
- Customizable graph templates: Appy Pie’s Graph Maker offers customizable graph templates that allow you to create graphs based on your specific data, such as profits, losses, income, expenses, and more. You can adjust colors, fonts, sizes, shapes, and other elements to match your requirements.
https://www.appypie.com/design/graph/maker
Use Cases of Appy Pie’s Online AI Graph Maker
- Remote Collaboration: AI Chart Generator F is an excellent tool for remote teams or professionals working across different locations. The cloud-based nature of the tool ensures that everyone can access and work on charts, regardless of their physical location.
- Client Reporting: Professionals in various industries, such as marketing agencies or consulting firms, can use AI Chart Generator F to create and share professional reports with clients. The tool’s sharing and embedding capabilities simplify the process of delivering valuable insights.
- Web and App Development: Developers can leverage AI Chart Generator F to create visually appealing charts for web and mobile applications. The ability to embed charts directly into the applications streamlines the development process and enhances user experiences.
FAQs (Frequently Asked Questions)
Can AI chart generators handle large datasets?
Yes, most AI chart generators can handle large datasets without compromising performance. They are designed to process and visualize vast amounts of data efficiently, allowing you to create charts and graphs from complex datasets seamlessly.
Are AI chart generators suitable for non-technical users?
Absolutely! AI chart generators are specifically designed to cater to users of all skill levels. They provide intuitive interfaces, pre-designed templates, and easy-to-use customization options, making the process of creating charts accessible to non-technical users.
Can I export the charts created with AI chart generators?
Yes, most AI chart generators offer export options. You can typically export charts in various formats, such as PNG, JPEG, or PDF, or even embed them directly into presentations or websites.
Are AI chart generators compatible with popular data analysis tools?
Many AI chart generators offer integrations with popular data analysis tools such as Excel, Google Sheets, and SQL databases. This allows you to import data seamlessly and leverage existing data analysis workflows.
How do AI chart generators ensure data security?
AI chart generators prioritize data security and employ various measures to protect your data. They typically utilize encryption protocols, secure data transfer, and adhere to industry-standard security practices to safeguard your information.
Can AI chart generators be used offline?
The majority of AI chart generators are web-based and require an internet connection. However, some tools offer offline functionality, allowing you to create and edit charts without internet access. It’s essential to check the features and specifications of each tool to determine if offline functionality is available.
What types of charts and graphs can I create with ChartBlocks AI?
With ChartBlocks AI, you can create a variety of charts and graphs, including bar charts, scatter plots, pie charts, histograms, and line charts.
Can I upload my own data to Akkio’s Chart Generator AI?
Yes, you can upload your own data to Akkio’s Chart Generator AI. It supports various data sources such as CSV, Postgres, and MySQL.
Does Graphmaker AI support the upload of spreadsheets and CSV files?
Yes, Graphmaker AI allows you to upload spreadsheets and CSV files to generate charts. You can visualize your data in the form of bar charts, scatter plots, pie charts, histograms, and line charts.
Is Appy Pie’s Graph Maker suitable for non-technical users?
Yes, Appy Pie’s Graph Maker is designed to be user-friendly and does not require any coding knowledge. It is suitable for non-technical users who want to create professional charts and graphs.
Can I customize the appearance of graphs created with Appy Pie’s Graph Maker?
Yes, you can customize the appearance of your graphs created with Appy Pie’s Graph Maker. You have the flexibility to change colors, fonts, sizes, and other elements to create a personalized and visually appealing graph.
How long does it take to create a knowledge graph using a Knowledge Graph Generator?
Using a Knowledge Graph Generator, you can create a knowledge graph in seconds. It saves you time compared to manually creating a knowledge graph, especially when dealing with large amounts of data.
Can I embed ChartBlocks in my Bit documents?
Yes, you can embed ChartBlocks in your Bit documents. It allows you to enhance your documents by adding interactive and visually appealing charts and graphs generated with ChartBlocks.
Does Chat Explore, powered by GPT-4, support analyzing datasets other than graphs and charts?
Yes, Chat Explore, powered by GPT-4, supports analyzing datasets beyond graphs and charts. It can assist data analysts and managers in interacting with their data and extracting insights in a natural and intuitive way.
Does Knowledge Graph AI support the visualization of complex data relationships?
Yes, Knowledge Graph AI supports the visualization of complex data relationships. It creates structured and organized views of data, representing concepts or entities as nodes and their relationships as edges.
Can I use Appy Pie’s Graph Maker to create flowcharts and mockups, in addition to graphs and charts?
Yes, in addition to creating graphs and charts, you can also use Appy Pie’s Graph Maker to create flowcharts and mockups. It provides flexibility in displaying various types of data in different formats.
Conclusion –Best AI Chart Generators
The availability of AI-powered chart and graph generation tools has significantly simplified the process of creating visually appealing and informative visualizations. Each tool mentioned in the previous chats offers unique features and benefits.
Chartify is an AI-powered tool that assists in generating interactive charts and graphs from CSVs and database tables. Its intuitive interface and AI recommendations make it a convenient choice for users looking to explore and visualize their data effortlessly.
Akkio’s Chart Generator AI, powered by GPT-4, leverages natural language processing to enable analysts and data managers to interact with their data in a conversational manner. This innovative approach eliminates the need for manual coding and empowers less technical users to participate in data analysis.
ChartBlocks AI provides an online platform for creating customized and interactive charts. With its wide range of chart types and the ability to pull data from various sources, users can quickly generate professional charts for their websites, blogs, and social media pages.
Appy Pie’s Graph Maker offers a user-friendly interface and drag-and-drop functionality, making it accessible to users with no coding knowledge. It provides a range of customization options and supports the creation of various graph types, including bar charts, pie charts, line charts, and even flowcharts and mockups.
Lastly, the knowledge graph AI tools mentioned in the chat enable the creation of structured and organized representations of data, facilitating a comprehensive understanding of complex data relationships.
3 Best AI Pets with Emotional capabilities
Overall, these AI-powered tools have revolutionized the process of graph and chart creation, saving time, and enhancing the accessibility of data visualization for both technical and non-technical users. Whether you need to analyze datasets, create visual reports, or enhance your documents with interactive charts, these tools offer efficient and user-friendly solutions to meet your needs.
trying out rhis apps by graphing my data